Published on Jan. 17, 2020
The Effects of Feed Rate and Feed Type on the Early Growth of Troutlodge Fry
Abstract
The primary objective of this study was to determine and provide customers with the optimal feed rate/diet during early rearing (from first feeding through 157 days). Results show that Troutlodge stocks can handle a much higher feed rate than dictated by feed manufacturer guidelines. Optimal growth without excess feed waste was achieved when fish were fed 150% of the manufacturer’s feed guidelines. Fish fed at 130% did have a slightly better average FCR through the study but fell behind the 150% group by 14.5% in terms of weight.
Our secondary objective was to determine the efficiency of the use of crushed brood diet as a replacement for conventional feed during this timeframe. Fish fed conventional feed showed lower FCR, higher TGC, and 73% higher weight at the end of the trial period when compared to fish that were fed a crushed brood diet.
Dates: Research initiated 1/4/2019, Research completed 6/10/2019
Genetic Group: 16brood November (Hoodsport)
Background
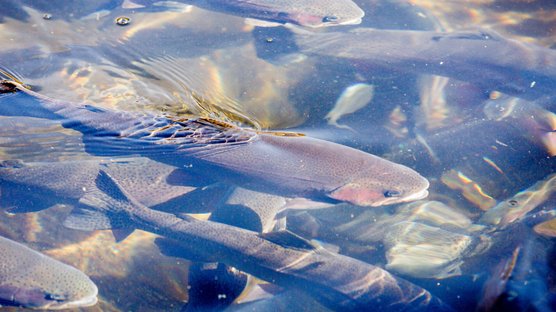
First feeding is a critical time for the overall well-being of a rainbow trout. To reach the full potential of our stocks we will need to know what feed rates/diets will work best in our environments. For our customers, it is invaluable to know the feed rate and diet that produces the most rapid and uniform growth for Troutlodge stocks. Some of our customers use a crushed brood diet in place of a conventional feed during early rearing.
Materials & Methods
Experimental design
Our first objective is to determine the best feed regime using Bio-Oregon BI-VITA starter feeds. We made modifications to the manufactures suggested feed rates at specific temperatures (see appendix). We used three feed rates with duplicate tanks for each. Feed rates started at 220%, 200%, and 180% of the feed manufactures recommended feed rate; after 2 weeks the feed ratios were reduced to 170% (high feed rate), 150% (mid feed rate), and 130% (low feed rate) due to significant overfeeding in the tanks receiving the highest feed rate. Troutlodge stock in this case are able to keep up with this increased feed rate over manufacturer recommendations. Weekly feed was calculated and fed out based on a 5 day per week schedule.
The second objective is to use the same feed percentages as above using crushed 9.5mm classic brood feed pellets. Crushed feed pellets are sometimes used by Troutlodge customers as an alternative to commercially available starter feeds. Using crushed feed mimicked the methods used by some of our customers in a production setting. Once fish reached ~3 grams (4/29/2019) they were switched to a 1.2 mm feed pellet.
Set-up & Measurement Protocols
We started with ~5000 eggs from a random production take (in this case 10/31 2 SP). After hatch and yolk absorption, groups of 400 were counted and ponded into 12 separate 150 liter tanks. Starting biomass was recorded and flows in all tanks were set equally.
Weight counts of each tank’s total biomass were conducted every other Monday and feed sheets were created. Feed sheets consider the projected growth over each two-week interval based on the specific growth rate (SGR) value generated from the feed manufacturer’s specific feed rate (SFR) recommendation using a feed conversion rate (FCR) of 0.8.
Weight Counts were used to calculate average fish size, group FCR, and group TGC for each two-week interval for the duration of the trial. All mortalities and culled fish were collected and recorded daily.
Results
*Note: Tank B2 (conventional diet, low feed rate) experienced a mass mortality over the weekend of 2/3/2019 due to an unseated standpipe. The 88 fish remaining have the benefit of much lower bio density and did very well. However, this tank has been thrown out of all following data.
Feed Rates Using Conventional Feed
Growth Curve
The tanks receiving the mid feed rate seem to be keeping up with the tanks receiving the high feed rate; at times outperforming the higher feed rate. Tanks receiving the low feed rate are lagging slightly behind. These relationships lead us to believe that the optimal feed rate for these fish in terms of rapid growth will be very near the mid feed rate in this trial (150% of manufacturer recommendations).
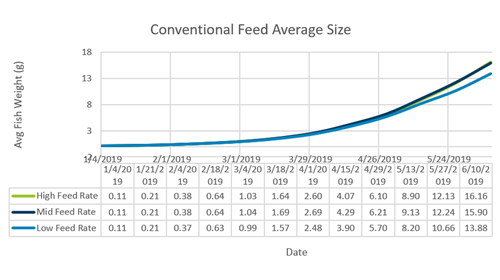
Figure 1. Shows average fish weight for each feed rate using conventional starter feeds.
FCR
There was more observed feed waste in the high feed rate tanks, this waste had a direct negative impact on the calculated FCR for these tanks.
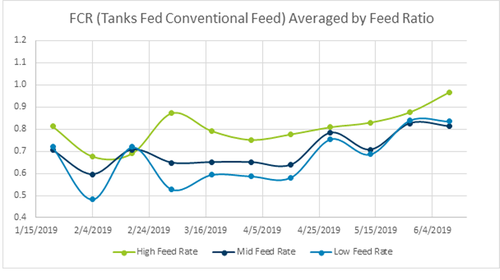
Figure 2. Shows average FCR for each feed regime. Excludes tank B2 due to mass mortality event.
TGC
Feed rate does not seem to have a significant impact on Thermal Growth Coefficient.
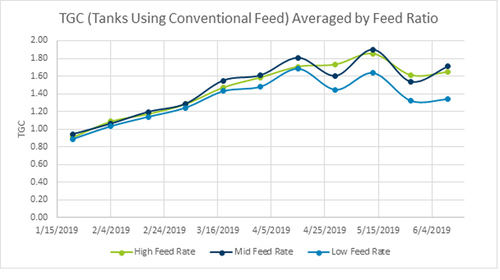
Figure 3. Shows average TGC per group. Excludes tank B2 due to mass mortality event.
Standard MID (150%) VS Manufacture’s Recommendation
Taking a look at the average growth performance of the standard feed mid diet (150%) VS a growth model using the Manufacturer’s suggested feed rate we see a significant difference. The fish grew to 15.9g while being fed at 150% of the MFG recommendation and the growth model suggest that fish would have only been 3.5g using the MFG guideline. The plateau observed in the percent differential line around 129 days may be due to the bio density rising above 20 kg/M3.
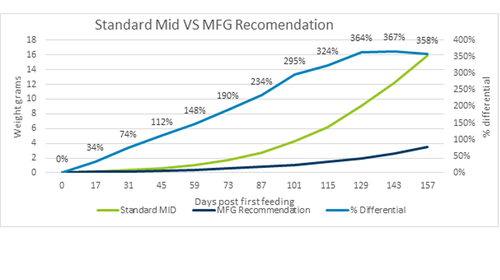
Figure 4. Shows observed growth curve for fish being fed the MID feed regime against a theoretical growth curve produced by using the manufacturers recommended feed rate. Red line represents the % difference between the two.
Crushed VS Conventional Feed
Growth Curve
Fish growth through the trial shows that the bio-vita diet provides 72.8% larger fish over the same timeframe. Fish fed Bio-vita starter feed reached an average of 15.38 grams within 157 days while fish fed a crushed brood diet reached an average of 8.90 grams.
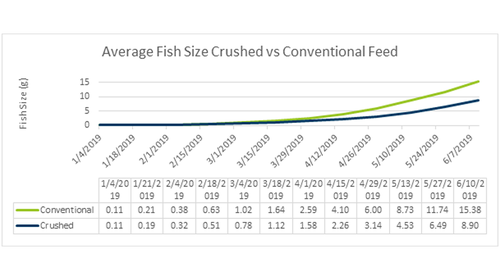
Figure 5. Shows average fish weight over the course of the study. Data was collected as total biomass of each tank every 14 days. Tank B2 Excluded from dataset
Group FCR
Feed Conversion Ratio (FCR) was lower for fish fed the Bio-Vita starter feed (Avg = 0.74 over the course of the study) compared to fish fed a crushed brood feed (Avg = 0.88 over the course of the study).
On 4/29 fish on the crushed feed diet were switched to a conventional diet. The FCR shows an almost immediate response to the feed type change.
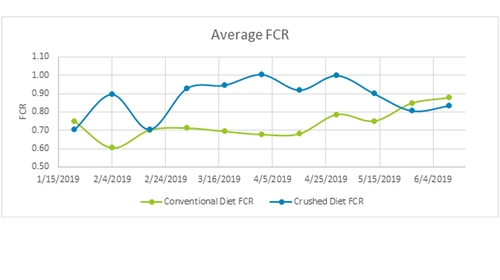
Figure 6. Shows FCR for each two-week period between weight counts. Note that FCR is very similar during the 3rd growth period. This may be caused by lower water temperatures in the TSP wet lab.
Group TGC
Thermal Growth Coefficient was higher for fish fed Bio-Vita starter feed when compared to a crushed brood feed diet. When crushing the brood feed, it was very difficult to match a #1 and #2 size crumb feed from Bio-Oregon in terms of particle size. This may partially explain the growing disparity in performance up until 4/29. Once fish that had been on a crushed diet were transitioned to conventional feed, they made major advancements in terms of TGC.
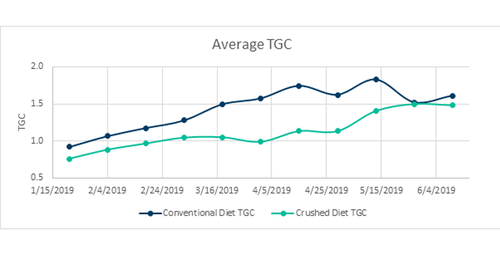
Figure 7. Shows the average TGC for the tanks fed standard diet and tanks fed a crushed diet.
Survival
All groups showed ≥90% survival after 157 days on the trial feed regimes. Although the crushed diet did have slightly higher survival percentages in the mid feed rate and high feed rate groups over this time period; a χ2 test showed that feed type and survival are independent at 157 days (p = 0.9891).
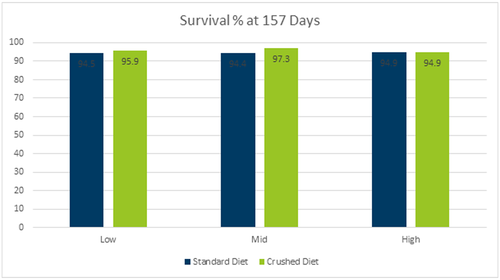
Figure 8. Shows survival data @ 157 days. Tank B2 Excluded due to mass mortality event.
Summary/Conclusion
Feed Rates Using Conventional Feed
Optimal feed rate seems to be higher than the original manufacturer recommendations. Raising the recommended feed rate by 30%, 50%, and 70% had a large impact on the growth curve without having a large negative impact on FCR. It appears that using a standard starter feed at 150% of the MFG recommendation performed the best within this study.
Crushed Brood Feed vs Bio-Vita
Although crushed feed may provide a cheaper alternative, use of conventional feed in this trial provided faster growth, more efficient FCR’s, and the ability to maximize resources in terms of production labor, infrastructure, and crop turnover.
Appendix
Bio Oregon Recommended Feed Regime
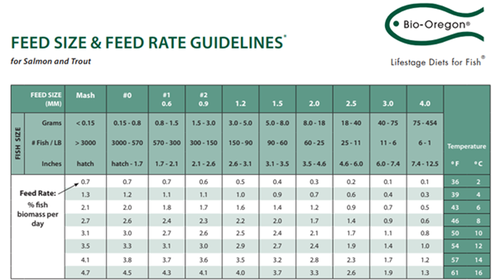
Feed size & Feed rate guidelines
Feed Conversion Ratio (FCR)
FCR= 〖Wt〗_Feed/(〖Wt〗_Final- 〖Wt〗_Initial )
Thermal Growth Coefficient (TGC)
TGC= (∛(〖Wt〗_Final )-∛(〖Wt〗_Initial ))/(Days x Temp(℃))
Specific Growth Rate (SGR)
SGR= SFR/FCR×100
SFR = Specific Feed Rate
FCR = Feed Conversion Ratio
Final Weight (Used to extrapolate feed sheets between weight counts)
〖WT〗_Final=〖WT〗_Initial×e^((SGR/100)×Days)
Average Wt=